Scan Visualization
2D Viewer
The 2D Viewer, shown in figure Fig. 7, is used to display the data collected by the detector frame by frame.

Fig. 7 The 2D Viewer.
To display a scan it must first be loaded with the scan loader. A double click on the corresponding item in the loader will display the counts on the detector.
- Observer
Position from which the detector is observed. Two possible values:
In frontand From behind.- Frames
Slider for select a particular frame of the scan. The frame can also be selected by introducing the frame number in the box at the right of the slider.
- Coordinates
X(px): x coordinate, in pixels, of the position of the mouse.
Z(px): z coordinate, in pixels, of the position of the mouse.
Counts: number of counts of the pixel the mouse is over.
\(\mathbf{{\gamma}_D,{\nu}_D}\): \(\gamma\) and \(\nu\) values, in degrees, of the detector.
d: d-spacing, in angstroms.
\(\mathbf{{\gamma}_P,{\nu}_P}\): \(\gamma\) and \(\nu\) values, in degrees, of the pixel the mouse is over.
\(\mathbf{\omega,\chi,\phi}\): \(\omega,\chi,\phi\) values, in degrees, of the eulerian cradle, if any.
\(\mathbf{2\theta}\): \(2\theta\) angle, in degrees, of the pixel the mouse is over.
H,K,L: Miller index for the pixel the mouse is over.
For computing \({\gamma}_P,{\nu}_P,d,2{\theta}\) the instrument geometry must be known. For computing Miller index the UB matrix must be known. The instrument parameters and the UB matrix can be obtained from the scan files. However, if the instrument and / or the crystal have been configured, they will have priority over the data coming from the scan files.
The toolbar
The toolbar of the viewer allows the user to interact with the image and to display the results of the different tasks carried out during the data reduction process, useful for verifying whether data reduction is being done correctly. The toolbar icons are described below:
 Reload the current scan.
 Play frame by frame the whole scan. The frame rate can be adjusted (see Settings).
 Apply efficiency corrections to the image. A calibration file must be set in Settings. Only used for XtremeD.
 Compute the total number of counts inside a box defined by the user.
 Display the observed and / or predicted peaks, computed respectively with the programs
 peakfindandint3d. In Settings the user can choose the markers to be displayed, their colors and their locations. The markers computed bypeakfindare located in the same directory wherepeakfindruns. The markers computed byint3dare located in a directoryMarkers/located in the directory whereint3druns. The color of the markers computed byint3ddepend on the domain. This color is specified in the crystal window. Display the integration boxes (background and peak) used during the integration. The boxes are expected to be in a directory called Boxes/ inside the integration directory specified in Settings. The color of these boxes can be changed in Settings.
 Display the integration masks used during the integration. The masks are expected to be in a directory called Masks/ inside the integration directory specified in Settings. The color of the mask can be changed in Settings.
 Display the integration ellipsoids (core, peak and background) for every integrated reflection. The ellipsoids are expected to be in a directory called Ellipsoids/ inside the integration directory specified in Settings. The color of the ellipsoids can be changed in Settings.
 Select an area of the detector and zoom in by holding down the left mouse button.
 Reset the original zoom.
 Colormap dialog, used to select the colormap used for displaying the data. By default, the color scale is rescaled when changing the frame. We recommend to remove the autoscaling and use a fixed scale. This is done by clicking on the
 Autoscalebutton of the colormap dialog, shown in figure Fig. 8.
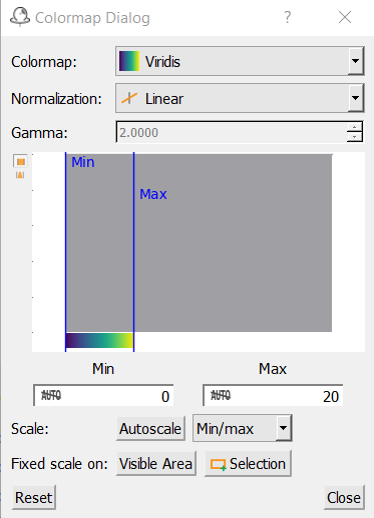
Fig. 8 Colormap dialog.
 Keep / not keep the aspect ratio of the image when resizing the viewer.
 Save the image in a file.
 Compute 1D profiles in horizontal, vertical or any arbitrary direction. It is also possible to set a line width so the 1D profile is derived not from a line but from an area.
 Remove the 1D profile.