Getting started
Int3D has three basic objects that are present in almost all of the tasks it can perform: the instrument, the crystal and the scans. This section contains, among other things, a description of how to set and work with these three objects.
User interface
The user interface of Int3D is shown in Fig. 1. Its main components are: the menu bar, the scan loader, the file explorer, the scan viewer and the terminal.
The menu bar has six menus: , , , , and . The menu is used to create, open and close projects. The menu allows to edit the project information, the instrument parameters, the crystal data and the general settings. The and menus contain the programs needed to perform the data reduction of single crystal and powder data respectively. The menu is used to calibrate the detector efficiency of XtremeD. Finally, the menu contains the utility Rspace, a graphical tool to work in the reciprocal space. If the FullProf Suite is already installed, it can be run from this menu.
The scan loader is used to load or remove scans. It also displays the main information contained in the scan files. The different programs used in the data reduction take the scans to be processed from the scan loader. In other words, if you want to process a particular scan, it must first be loaded with the scan loader.
The file explorer is useful for viewing the output files produced by the Fortran programs. If a text editor has been configured in Settings, then double clicking a text file on the file explorer will open it in the text editor.
The scan viewer displays the detector counts in 2D (frame by frame) or in 3D (the whole scan at once). The 2D viewer is the main viewer used during the data reduction. It allows you to visualize the detected peaks as well as the integration results, i.e., predicted peak positions, integration boxes, masks and ellipsoids.
The terminal displays the standard output of the Fortran programs, and it is very useful for detecting possible errors.
The scan loader, the scan viewer and the terminal can be resized by placing the mouse between two of these elements and holding down the left mouse button. The elements can be expanded horizontally or vertically.
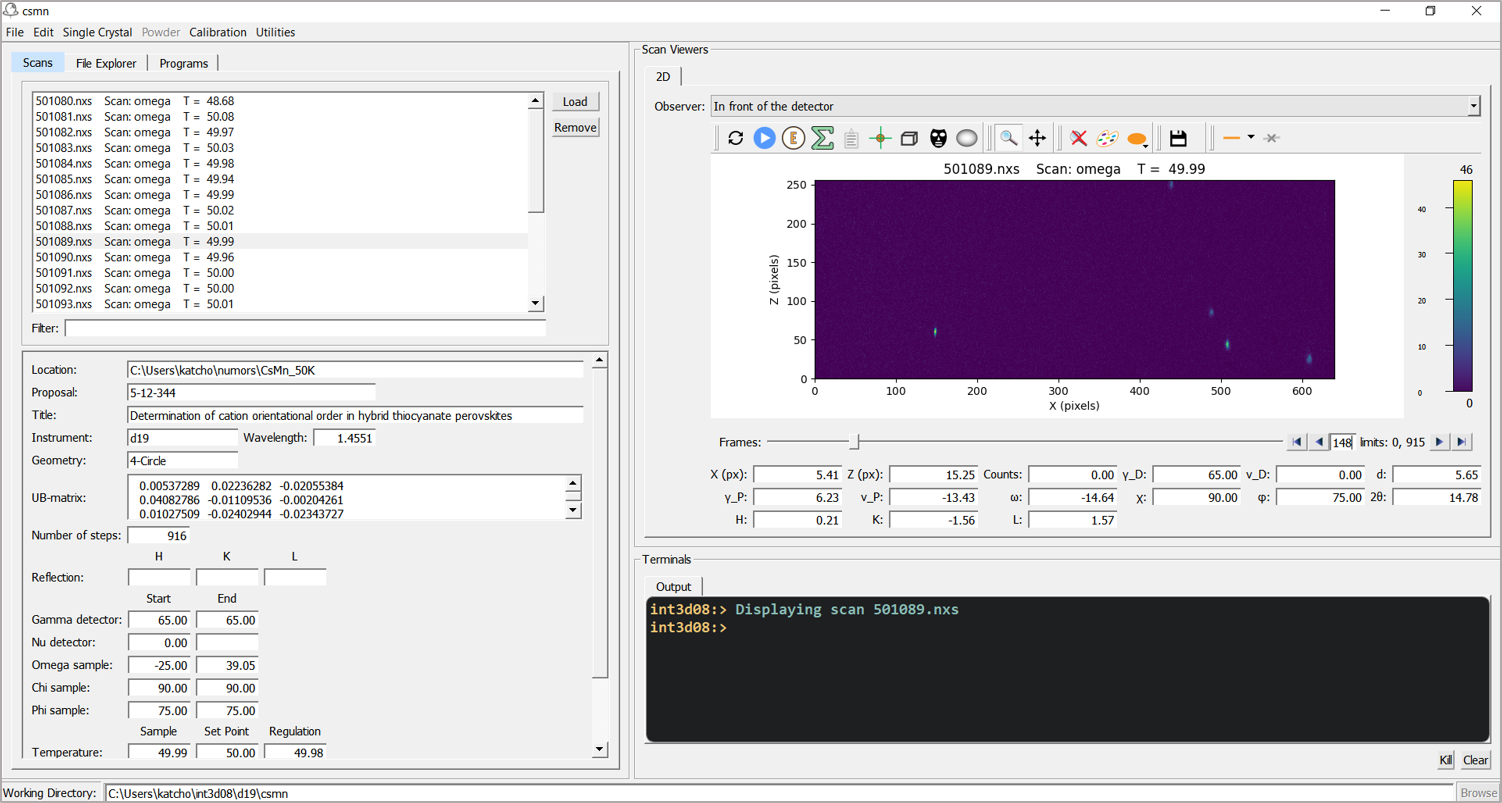
Fig. 1 Main window of Int3D.
Creating a project
The data reduction can be carried out with or without defining a project. However, a project helps to organize the information and allows you to retrieve the scans, instrument and crystal data when starting a new session.
A project is created by clicking in the menu. Int3D then displays the project window (Fig. 2), in which the user must enter the project name, the project directory, the scans directory, the instrument and the experiment. It is always good practice to work with directories and names without white spaces and non ASCII-characters.
All the scans located in the scans directory are automatically loaded in the scan loader when the project is created or opened.
Every project has three files with fixed names, located in the project directory:
project_name.pro: the project settings (Fig. 2). This is the file that has to be selected to reopen the project.
instrument_name.geom: the instrument definition.
project_name.cry: the crystal parameters.
Every project folder has several sub-folders. For a single crystal project the sub-folders are Peaks/, UB/ and Integration/. For a powder project, the sub-folders are Process/ and Integration/. The content of these sub-folders is explained in Single crystal data reduction and Powder data reduction sections respectively.
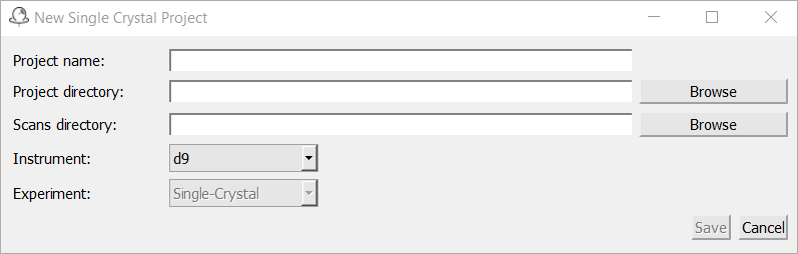
Fig. 2 Project window.
Instrument
The instrument window, shown in Fig. 3, is opened by clicking in the menu. The instrument definition follows the Busing-Levy convention (Acta Cryst. (1967). 22, 457-464). The instrument parameters are described in the panel below.
D9, D10, D16, D19, XtremeD from ILL, DMC and Zebra from PSI and Wombat from ANSTO.
y axis along the beam direction. If we look from the sample toward the detector, and the positive θ direction is to our right, then the Busing-Levy convention sets the z-axis upward (z-up). Otherwise, the z-axis is directed downward (z-down).
Flat and H-Banana (horizontally curved). The type determines the equations for moving from real to reciprocal space. If the user is interested in how the conversion is done, details can be found in the routine psd_convert of CrysFML08 library.
BottomLeft, BottomRight, TopLeft, and TopRight.
x (horizontal) and z (vertical) dimension.
x (horizontal) and z (vertical) dimension.
x, z) and beam direction (y).
Most of the parameters, with the exception of the wavelength and offsets, are fixed and do not have to be changed by the user. Default values for a given instrument can be set by clicking on the button.
An instrument file can be loaded by clicking on the button.

Fig. 3 Instrument window.
Crystal
The crystal window, shown in Fig. 4, is opened by clicking in the menu. The crystal parameters are described in the panel below.
a, b and c lattice parameters in Å and α, β and γ lattice angles in degrees.
P1.
UB matrix. Every phase must have at least one crystal domain. There are two ways to provide the UB matrix:
- Typing it into the text editor. It must be written as a 3x3 matrix, i.e. on three separate lines. Copy and paste from an editor or from the scan loader works.
- Using the . This button opens a file browser. After selecting a file, Int3D will search a line starting with
UBMAT. When such a line is found, Int3D expects the UB matrix given in the three next lines.
UB matrix.
UB matrix and the k-vectors.
UB matrix is the one used for indexing pixels in the 2D viewer.
k1=(0.25,0.00,0.00)k2=(0.50,0.00,0.00)k3=(0.00,0.25,0.00)k3=(0.25,0.25,0.00)
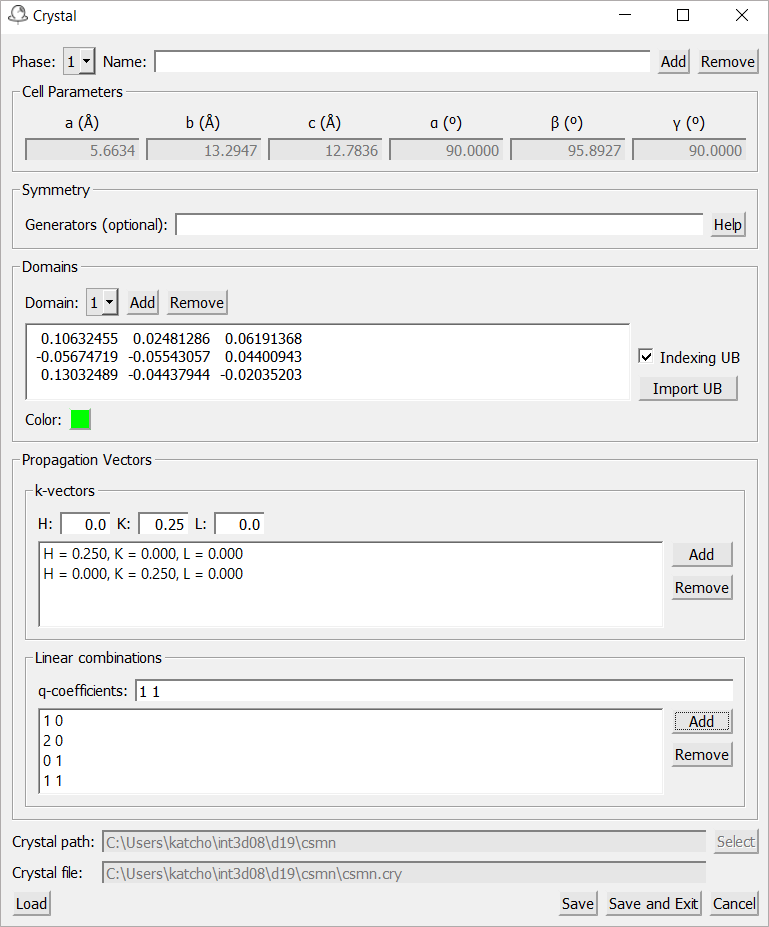
Fig. 4 Crystal window.
Scans
Scans are loaded into and removed from the application with the scan loader, shown in Fig. 1 and Fig. 5.
The scan loader assigns an item text to every loaded scan. This item contains at least the name of the scan file, the scan type and the number of steps. For D9 and D10 the Miller indexes of the measured reflection are added. If the temperature, pressure or magnetic field are specified in the scan file, they are also included in the item text.
A double click on an item displays the scan on the 2D Viewer.
The filter
It is used to filter out some of the loaded scans. This makes it much easier to deal with scans when the scan list is very long, which is often the case for instruments with small detectors. The filtering is done by pattern matching between the text introduced by the user and the items. Let’s see at some examples:
0222       # List scans starting by 0222
T=15       # List scans collected at 15 K. White-spaces around the equal sign are not significant. T = 15 or T =15 will work as well
T=15 + H=1 # List scans collected at T = 15 and H = 1
ome        # List omega scans
ome + T=15 # List omega scans collected at T=15

Fig. 5 Scan loader window.
Settings
Settings can be edited by clicking on Settings action in Edit menu (Fig. 6). The settings window contains some user preferences read by int3d when it is launched. The settings are organized in three groups:
Instrument
External programs
Calibration files
Settings are saved written in the file to the file int3d.ini (see below).
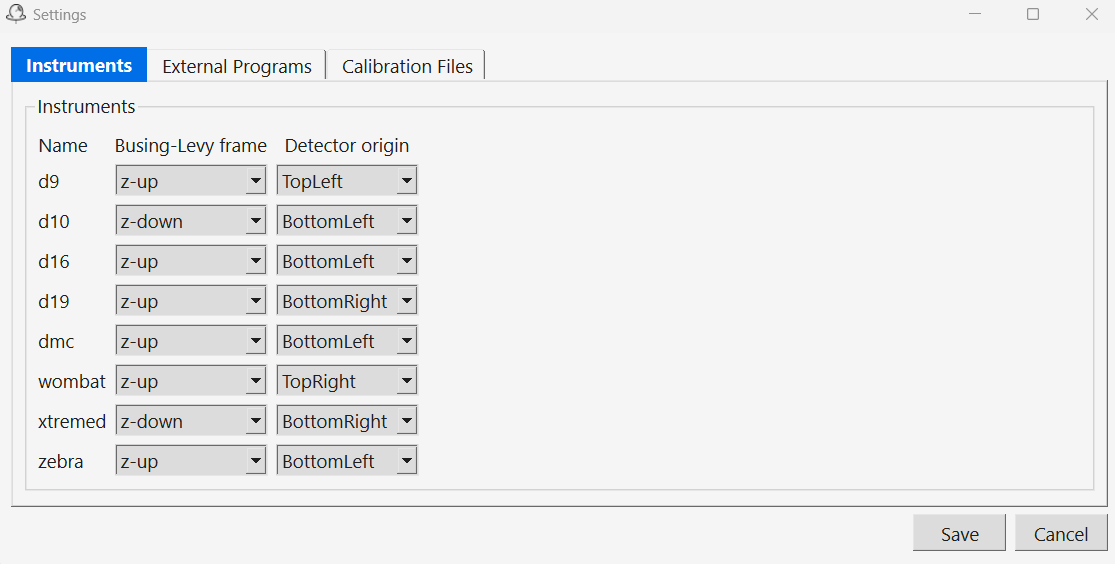
Fig. 6 Settings window.
Initialization Files
Each time int3d initialises, it looks for two files called int3d.ini and settings.txt located in the user home directory.
- int3d.ini
It contains the last ten projects opened by the user and the last working directory. After initialization, the working directory is taking from this file if it exists, and the list of recent projects are added to the menu in the menu.